In this article, you will learn how to use the Forecast feature in the energy management platform.
Contents:
Introduction
Forecast allows you to have energy consumption and solar production predictions for buildings up to a year ahead, based on historical data, weather and calendar data.
The available forecast targets for this feature are:
- Electricity consumption.
- Gas consumption
- Water consumption.
- Electricity generation.
For each building, there are 2 forecasts calculated:
| Short-term forecast | Long-term forecast | |
| Scope | 10 days | 1 year |
| Resolution | Hourly | Daily |
| Input variables |
|
|
Nomenclature
Firstly, it is necessary to explain the nomenclature used in this feature:
-
Forecast Target: The specific outcome or variable that the forecast aims to predict, such as energy consumption, solar production, or gas usage.
-
Forecast Input: The data used to generate a forecast, including historical consumption data, weather forecasts, holidays, and any other relevant parameters.
-
Model: The actual machine learning model that is used, since it predicts best the forecast target (it has the lower error in prediction).
-
Feature Importance: A measure of how much a particular input or variable contributes to the accuracy of a forecasting model, helping identify which factors most influence the predictions.
-
Forecast Metrics: The performance indicators used to evaluate the accuracy and quality of the forecast, such as Mean Absolute Error (MAE) or Root Mean Square Error (RMSE).
Requirements
In order to use the Forecast feature, you need to meet the following requirements:
- Consumption data needs to be (at least) hourly.
- Categories need to be configured in the location.
Configuration
The configuration needed to create a Forecast is the following:
-
Forecast target:
- First, you have to define the specific outcome to predict (e.g., electricity consumption, gas or solar production).
- Then, you need to specify the location, reference meter and parameter to forecast.
-
Forecast inputs:
- The next step is to choose the inputs from available data, such as weather parameters and holidays.
- You can customise which variables are included in the forecasting model
-
Acceptance of DP:
- Finally, you need to agree the acceptance of a new data point that will appear in the configuration.
Visualisation
Forecast results
In order to display the electricity, water or gas forecast, you just need to choose its parameter in any Analytics screen or dashboard, with a forecast horizon, displayed hourly for the first 10 days and daily for the following days up to 365 days.
- Configuring By parameter:
- Configuring By category:
In order to configure the analysis, it is very useful to select "Until the end of the period" in the period selector, in order to ensure that future dates will be displayed in the screen:
Forecast page
Main forecast page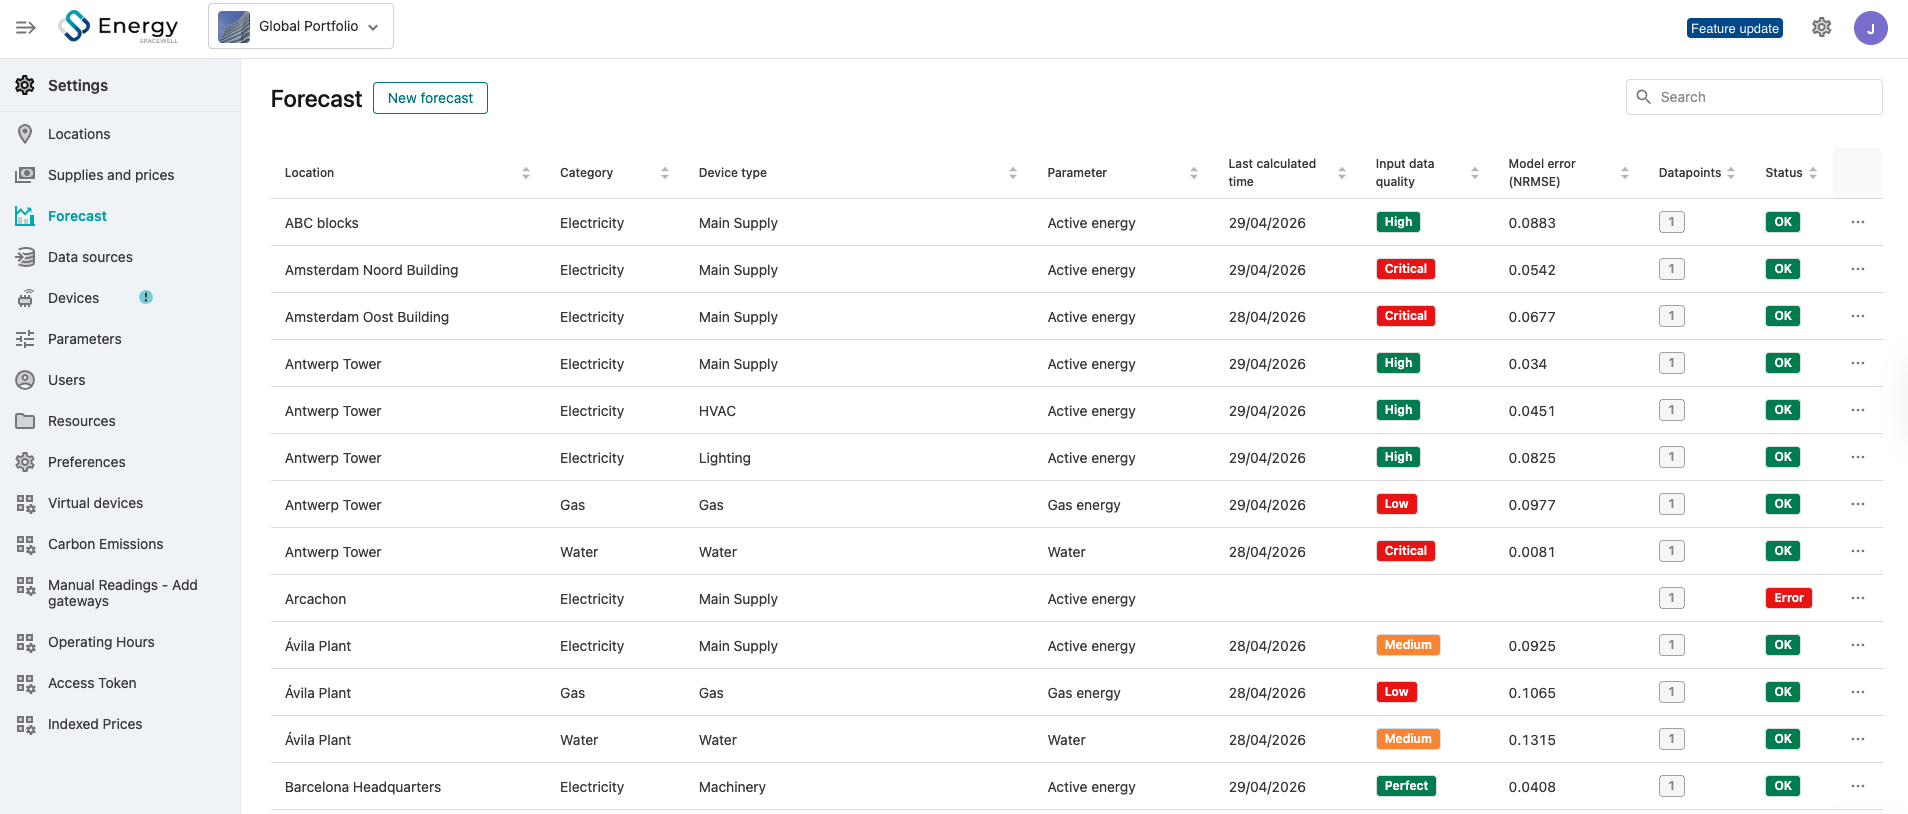
In the main forecast page, you will see a list of all the forecasts that have been configured in the account with the following information:
- Context information: Location, Category, Device type and Parameter for which the forecast has been configured.
- Last calculated time: The last day that we were able to calculate the forecast.
- Input data quality: The data quality score given to the customer input data.
- Model error: The error obtained during forecast training. The smaller the error, the better the forecast.
- Status: OK, Pending, Warning, Error.
Forecast detail
When clicking on any forecast, you will be redirected to the page that will let you edit or learn more about that particular forecast. The included information is the following:
- Features importance. Insights into which variables (e.g., weather, holidays) influence the most in the forecast, separated into short-term and long-term forecasts.
- Model metrics. Performance indicators, including Mean Absolute Error (MAE) and Root Mean Square Error (RMSE).
-
Last training date: Information about the latest training session.
- Input data quality: meaning an analysis of the status of the customer's data that has been used to generate results. The customer's data quality highly affects the forecast accuracy. That's why we perform an in-depth analysis of this input data in order to warn of any issues that might affect the results. The data quality is assessed based on the 9 categories that can be observed below:
If that forecast has a status of Error or Warning, by accessing the detail page, you will also learn more details about the error or warning.
To keep in mind
The Forecast feature has the following limitations. Some of them will be deleted in future releases:
- If you change the configuration of the reference meter or the historical data for a certain meter, this can affect the results.
- If data quality for the historical data is not good enough, the forecast results will be as bad.
- You cannot choose which Machine Learning model will be used for the forecast, we will choose the best one among our offerings.
- You cannot specify the weight of specific parameters, we will choose the one that optimises results.
Pricing
Each forecast you create will generate one data point. All of them will be charged according to your pricing.
The Forecast feature is only included in Advanced and Ultimate Licences.
Feedback
If you have questions or need help setting up this tool, please feel free to contact our support team.
We are here to help you get the most out of Forecast's functionality!
Also, if you would like to give us your feedback on this feature, you can do so with this form: